How to create dynamic Javascript graph chart with php?
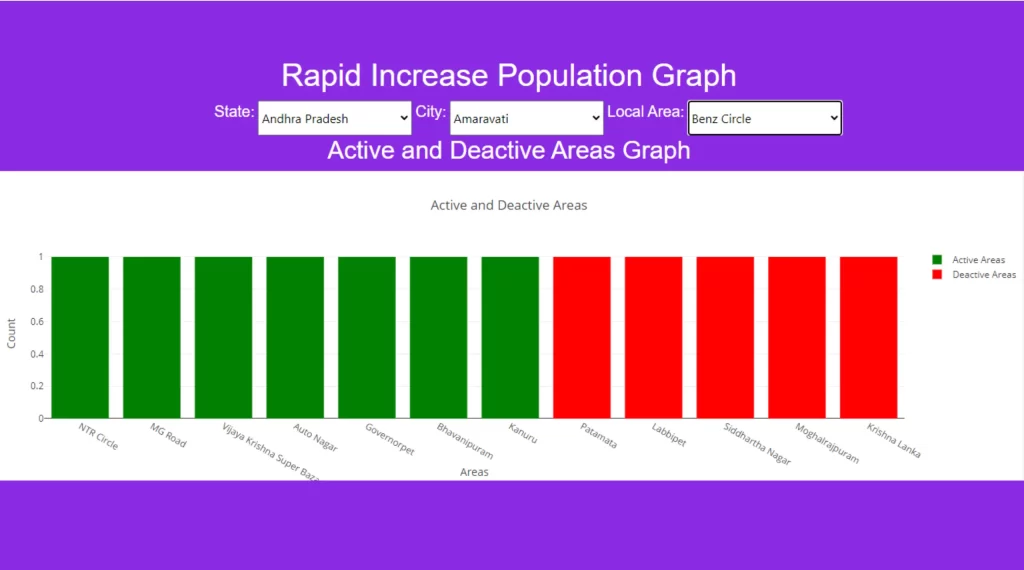
Dynamic Javascript graph chart play an important role in modern web development to display any budget and population of that area. This post will show you that how to create dynamic population graph using JavaScript. The article shows how to generate an exponential growth population graph with a dropdown filter and a Plotly.js-powered visualization.
Database for Javascript graph chart
To use dynamic Javascript graph chart, firstly you will need to create a database . In this tutorial, we’ll create a mysqli database called location_db, which contains three key tables: state, city, and local_region. These tables constitute the basis for dynamic filtering and generating population trend graphs.
HTML Structure (index.php):
- It defines the basic webpage structure, with header, body, and footer sections.
- It includes essential JavaScript and CSS libraries like jQuery, Plotly, and Bootstrap.
- Creates a form with dropdown menus for State, City, and Local Area selection.
- Displays a placeholder for the graph (
<div id="areaGraph"></div>)
					<!DOCTYPE html>
<html lang="en">
<head>
    <meta charset="UTF-8">
    <meta name="viewport" content="width=device-width, initial-scale=1.0">
    <title>Dynamic Location Selector and Plotly Graph</title>
    <script src="https://code.jquery.com/jquery-3.6.0.min.js"></script>
    <script src="https://cdn.plot.ly/plotly-latest.min.js"></script>
    <link href="https://cdn.jsdelivr.net/npm/bootstrap@5.0.2/dist/css/bootstrap.min.css" rel="stylesheet" integrity="sha384-EVSTQN3/azprG1Anm3QDgpJLIm9Nao0Yz1ztcQTwFspd3yD65VohhpuuCOmLASjC" crossorigin="anonymous">
    <link href="style.css" rel="stylesheet" type="text/css"/>
</head>
<body>
    <h1 class="text-center">Rapid Increase Population Graph</h1>
<br><br>
    <form>
        <!-- State Dropdown -->
        <label for="state">State:</label>
        <select id="state" name="state"class="form-group">
            <option value="">Select State</option>
            <?php foreach ($stateData as $state) : ?>
                <option value="<?php echo $state['id']; ?>"><?php echo $state['name']; ?></option>
            <?php endforeach; ?>
        </select>
<br><br>
        <!-- City Dropdown -->
        <label for="city">City:</label>
        <select id="city" name="city" disabled>
            <option value="">Select City</option>
        </select>
<br><br>
        <!-- Local Area Dropdown -->
        <label for="local_area">Local Area:</label>
        <select id="local_area" name="local_area" disabled>
            <option value="">Select Local Area</option>
        </select>
    </form>

<h2 class="text-center">Active and Deactive Areas Graph</h2>
    <div id="areaGraph" style="width:100%; height:400px; padding-bottom:45px"></div>

    <script src="https://cdn.jsdelivr.net/npm/bootstrap@5.0.2/dist/js/bootstrap.bundle.min.js" integrity="sha384-MrcW6ZMFYlzcLA8Nl+NtUVF0sA7MsXsP1UyJoMp4YLEuNSfAP+JcXn/tWtIaxVXM" crossorigin="anonymous"></script>
</body>
</html>
2. Backend: Fetching Dynamic Data for Javascript graph chart with PHP and MySQLi
The backend uses PHP and MySQLi to dynamically fetch data based on user selection. Here’s the code to show data for states, cities, and local areas:
					<?php
$host = 'localhost';
$user = 'root';
$password = '';
$database = 'location_db';
$conn = mysqli_connect($host, $user, $password, $database);
if (!$conn) {
    die("Connection failed: " . mysqli_connect_error());
}

// Fetch States
$sql = "SELECT id, name FROM states";
$stateResult = mysqli_query($conn, $sql);
$stateData = [];
while ($row = mysqli_fetch_array($stateResult)) {
    $stateData[] = $row;
}

// Fetch Cities
$sql = "SELECT id, name, state_id FROM cities";
$cityResult = mysqli_query($conn, $sql);
$cityData = [];
while ($row = mysqli_fetch_assoc($cityResult)) {
    $cityData[] = $row;
}

// Fetch Local Areas
$sql = "SELECT id, name, city_id, active_areaname, deactive_areaname FROM local_areas";
$localAreaResult = mysqli_query($conn, $sql);
$localAreaData = [];
while ($row = mysqli_fetch_assoc($localAreaResult)) {
    $localAreaData[] = $row;
}

mysqli_close($conn);
?>
This PHP code allows dynamic retrieval of hierarchical data for create real-time graphs and charts.
3. Frontend: Dynamic dropdown for graph filter
Dynamic graphs and charts require the user to filter inputs and visualize specific datasets. Using jQuery, the following code dynamically populates the city and local area dropdowns based on user selection:
					$(document).ready(function () {
    const cityData = <?php echo json_encode($cityData); ?>;
    const localAreaData = <?php echo json_encode($localAreaData); ?>;

    $('#state').on('change', function () {
        const stateId = $(this).val();
        $('#city').prop('disabled', false).html('<option value="">Select City</option>');

        cityData.forEach(city => {
            if (city.state_id == stateId) {
                $('#city').append(`<option value="${city.id}">${city.name}</option>`);
            }
        });
    });

    $('#city').on('change', function () {
        const cityId = $(this).val();
        $('#local_area').prop('disabled', false).html('<option value="">Select Local Area</option>');

        localAreaData.forEach(area => {
            if (area.city_id == cityId) {
                $('#local_area').append(`<option value="${area.id}">${area.name}</option>`);
            }
        });
    });
});
With this arrangement, dropdown menus can be updated in real time, ensuring smooth navigation for dynamic charts and graphs.
4. Visualizing Data with Dynamic Graphs Using Plotly.js
Using specific data, Plotly.js creates dynamic Javascript graph chart and graphs. The code to create a bar chart comparing active and inactive areas is given below:
					$('#local_area').on('change', function () {
    const areaId = $(this).val();
    const selectedArea = localAreaData.find(area => area.id == areaId);

    if (selectedArea) {
        const activeAreas = selectedArea.active_areaname.split(',').map(item => item.trim());
        const deactiveAreas = selectedArea.deactive_areaname.split(',').map(item => item.trim());

        const data = [
            {
                x: activeAreas,
                y: Array(activeAreas.length).fill(1),
                type: 'bar',
                name: 'Active Areas',
                marker: { color: 'green' }
            },
            {
                x: deactiveAreas,
                y: Array(deactiveAreas.length).fill(1),
                type: 'bar',
                name: 'Deactive Areas',
                marker: { color: 'red' }
            }
        ];

        const layout = {
            title: 'Active and Deactive Areas',
            barmode: 'group',
            xaxis: { title: 'Areas' },
            yaxis: { title: 'Count' }
        };

        Plotly.newPlot('areaGraph', data, layout);
    }
});
This code dynamically updates the chart based on the selected local area, making it an effective tool for real-time data visualization.
5. Styling a dynamic graph interface
Using CSS, you can enhance the visual appeal of dynamic graphs and charts. Here’s an excerpt from the style used:
					*{
    margin: 0;
    padding: 0;
    overflow-x: hidden;
}
body{
    background-color: blueviolet
}
h1, h2, h3, p, label{
    color: white;
    font-family: "poppin", sans-serif;
}
form{
    margin-left: 22%;
}
select{
    height: 45px;
    width: 200px;
}
br{
    display: none;
}
label
{
    font-size: 20px;
}
@media only screen and (max-width:768px)
{
 form
{
   margin-left: 0%!important;
}
br
{
    display: block;
}
}
Features of Dynamic Graphs and Charts
- Real-Time Updates: Dropdowns and graphs update dynamically based on user selection.
- Interactive Visualization: Users can interact with the graphs for detailed information.
- Custom Filters: State, city and local area filters make the app highly customizable.
Why Use Dynamic Graphs and Charts?
Dynamic graph charts provide an engaging way to understand data, especially population trends. This combination of PHP, MySQLi, JavaScript and Plotly.js ensures a scalable and interactive solution to data visualization needs.
Dynamic graph source code
Send download link to:

