Today, making sense of and message important information requires Overview and communication skills that aid in data visualization. One of the most common and effective means of data representation is pie charts, which provide a quick and effective way of understanding the parts of a whole. In this post I would help you in making the pie chart using JavaScript with the help of plotly library which is one of the best libraries for interactive data visualization.
Before you can start, you must first use the Plotly library into your HTML document. Plotly is an open-source and free JavaScript graphing library that helps in creating charts in an interactive way. The following is how to link the library using a CDN (Content Delivery Network):
Next up, start by establishing the plain body structure of your HTML document. It will be required a div element to contain your pie chart too. If you want a concise answer, here it is:
<div id="mydiv" style="width: 100%;"></div>
This div will expand to fill the width of its parent container, allowing for a responsive design.
Defining Data for the Pie Chart
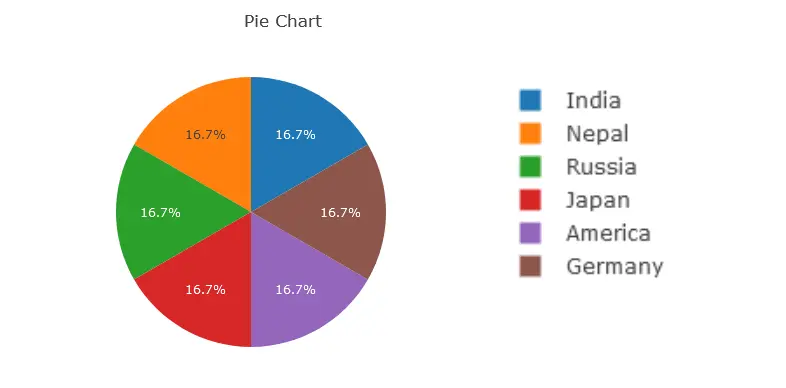
To create the pie chart, you’ll need to define the data you want to visualize. In this example, we’ll represent the populations of different countries. Here’s how you can set up your data arrays:
To make the pie chart, you need to specify some data that should be displayed. The populations of various countries, will be representation in the code. How to Create Your Data Arrays
					var countrypop = ["India", "Nepal", "Russia", "Japan", "America", "Germany"];
var population = [250000, 1000000, 8540000, 549000, 780151, 7814556];
Creating the Pie Chart
Define with the data in place then create pie chart. You can specify chart type and layout in Plotly. Pie Chart with title code from mplot3DDocs
					var layout = { title: "Pie Chart" };
var data = [{
    labels: countrypop,
    values: population,
    type: "pie",
}];
Plotly.newPlot("mydiv", data, layout);
The data array in the above code has an object where the labels and values for Pie chart are given. Title- This part of layout object is the title which you specific for the chart.